> ## Documentation Index
> Fetch the complete documentation index at: https://docs.comfy.org/llms.txt
> Use this file to discover all available pages before exploring further.
# Performance Tests and Benchmarks
> Measure ComfyUI workflow speed with Performance Tests, then compare runs across GPUs, workflows, and instances with Benchmarks in Comfy Desktop
**Performance Tests** measures how long a ComfyUI workflow takes to run on one of your instances. You pick an instance, load a workflow, and Comfy Desktop runs it a set number of times, timing every measured run and reporting the fastest, slowest, average, and median duration together with the hardware and software the numbers came from.
**Benchmarks** compares those recorded results. It lists every saved run, filters them by workspace, instance, hardware, or workflow, and lines up selected runs side by side with a relative speed factor, so you can see how much faster one GPU, workflow, or instance is than another.
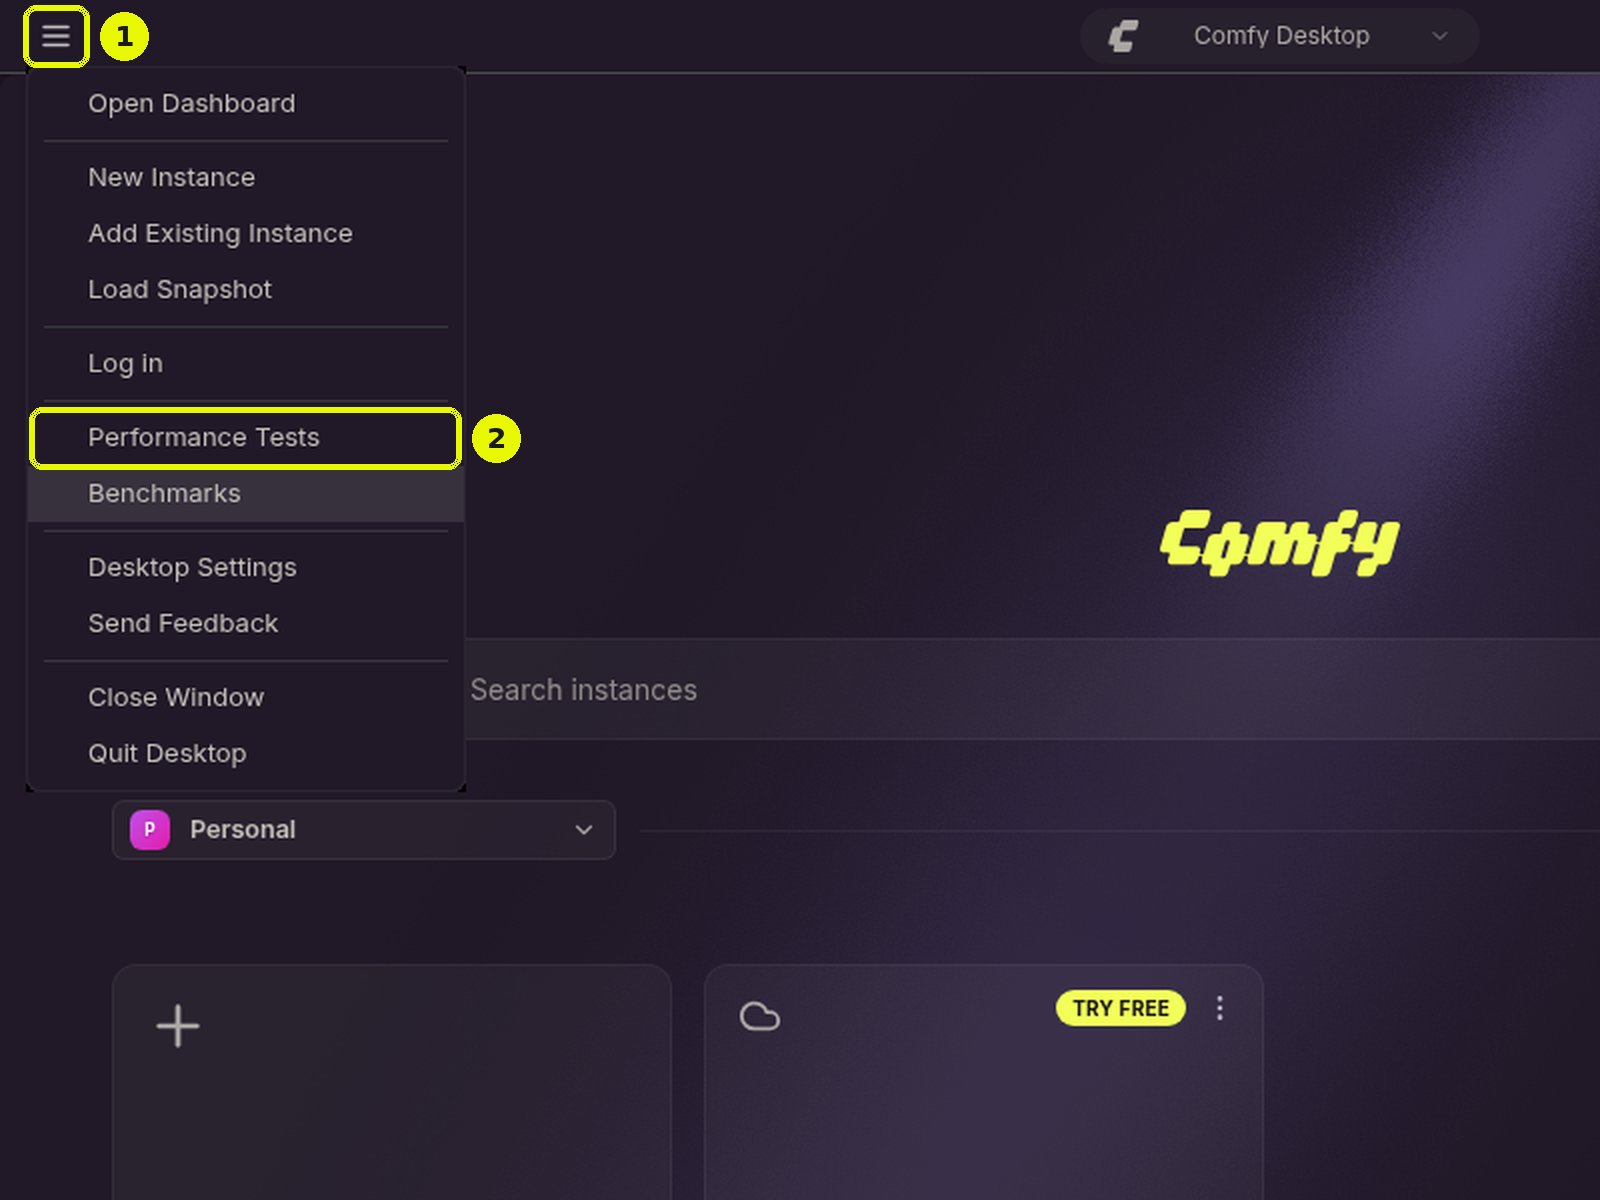
Both panels open from the hamburger menu (☰) in the top-left corner of the Dashboard title bar, not from a left sidebar. Click the ☰ button (1), then choose **Performance Tests** (2), or **Benchmarks** just below it:
 Performance Tests runs a real workflow on a real instance, so a test takes roughly as long as the workflow itself multiplied by the number of runs. Workflows you import have to be exported in [API format](/development/api-development/workflow-api-format) first. The example workflows that ship with Comfy Desktop are already in that format.
## Running a Performance Test
The panel is laid out as three numbered steps side by side. They stack vertically on narrow windows.
Performance Tests runs a real workflow on a real instance, so a test takes roughly as long as the workflow itself multiplied by the number of runs. Workflows you import have to be exported in [API format](/development/api-development/workflow-api-format) first. The example workflows that ship with Comfy Desktop are already in that format.
## Running a Performance Test
The panel is laid out as three numbered steps side by side. They stack vertically on narrow windows.
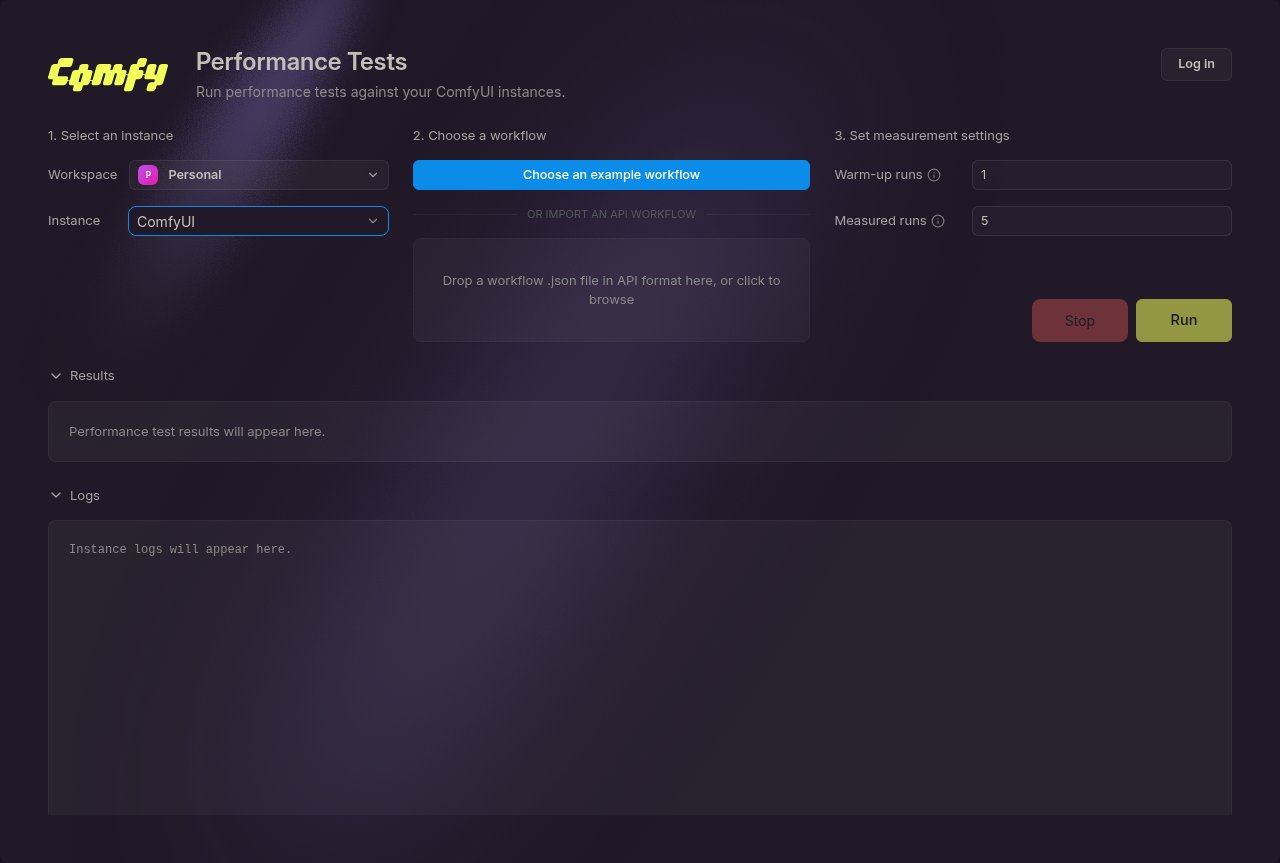 ### 1. Select an instance
Choose the **Workspace** and the **Instance** to test. The instance and its hardware are recorded with the results, which is what makes later comparisons meaningful: runs from different GPUs stay distinguishable.
When you start a test, Comfy Desktop stops that instance's previous performance test session if one is still running, then launches the instance in a console session. Comfy Desktop refuses to start a test while any other local ComfyUI is running, still starting, or stopping, and names the instances in the way. Stop them, or wait for them to finish starting or stopping, then run the test again. Comfy Cloud and remote instances run elsewhere and never block a test. Other work that keeps the GPU busy, such as a game or a video export, still affects the numbers, so stop it before you run a test.
### 2. Choose a workflow
You can pick an example workflow that ships with Comfy Desktop, or bring your own.
**Example workflows** are ready to run, and their models are downloaded for you. Click **Choose an example workflow** to open the picker. It groups the examples into modality tabs (Video, Image, 3D, and Audio; only modalities that have examples get a tab), and each card shows the example's name, task, and how much its models download. Click **Use workflow** to select one. Comfy Desktop then downloads any models the workflow is still missing, and the drop zone shows the download progress until it finishes. To pick an example, the instance has to be fully installed and you have to be online; if the models would not fit in the free disk space, the picker blocks the selection. Example workflows are tied to an instance: switching to another instance drops the example prepared for the first one, unless that example's session already recorded results.
**Your own workflow** has to be exported in [API format](/development/api-development/workflow-api-format). Drop the `.json` file onto the drop zone, or click the zone to browse for one.
### 1. Select an instance
Choose the **Workspace** and the **Instance** to test. The instance and its hardware are recorded with the results, which is what makes later comparisons meaningful: runs from different GPUs stay distinguishable.
When you start a test, Comfy Desktop stops that instance's previous performance test session if one is still running, then launches the instance in a console session. Comfy Desktop refuses to start a test while any other local ComfyUI is running, still starting, or stopping, and names the instances in the way. Stop them, or wait for them to finish starting or stopping, then run the test again. Comfy Cloud and remote instances run elsewhere and never block a test. Other work that keeps the GPU busy, such as a game or a video export, still affects the numbers, so stop it before you run a test.
### 2. Choose a workflow
You can pick an example workflow that ships with Comfy Desktop, or bring your own.
**Example workflows** are ready to run, and their models are downloaded for you. Click **Choose an example workflow** to open the picker. It groups the examples into modality tabs (Video, Image, 3D, and Audio; only modalities that have examples get a tab), and each card shows the example's name, task, and how much its models download. Click **Use workflow** to select one. Comfy Desktop then downloads any models the workflow is still missing, and the drop zone shows the download progress until it finishes. To pick an example, the instance has to be fully installed and you have to be online; if the models would not fit in the free disk space, the picker blocks the selection. Example workflows are tied to an instance: switching to another instance drops the example prepared for the first one, unless that example's session already recorded results.
**Your own workflow** has to be exported in [API format](/development/api-development/workflow-api-format). Drop the `.json` file onto the drop zone, or click the zone to browse for one.
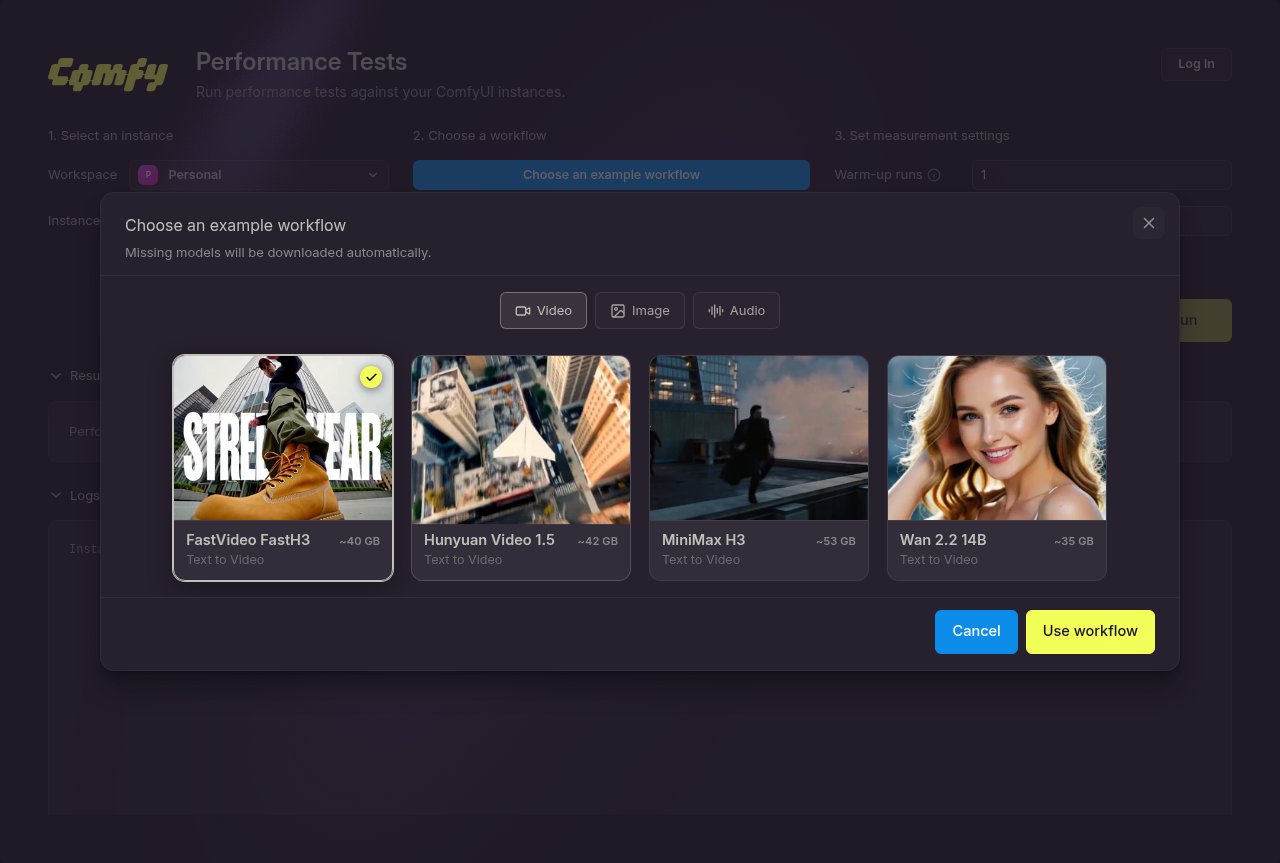 Either way, Comfy Desktop copies the workflow into the test session folder, so the test still runs after you move or edit the original file.
### 3. Set measurement settings
| Setting | Range | Default | What it does |
| - | - | - | - |
| **Warm-up runs** | 1 to 5 | 1 | Runs executed first to load models and warm up caches. They are not included in the results. |
| **Measured runs** | 1 to 100 | 5 | Runs timed after the warm-up runs. Their durations are used to calculate the results. |
Every run advances the workflow's numeric seed inputs by one, so the measured runs do not repeat an identical cached result.
Once the three steps are set, click **Run** to start the test. The **Stop** button next to it cancels a test that is in progress.
### Read the results
While the test runs, the panel shows how many runs have finished and the instance logs. When every run finishes, the instance is stopped and the results appear:
* **Fastest run**, **Slowest run**, **Average run**, and **Median run**, in seconds
* **Measured runs** and **Failed runs**: how many runs produced a duration and how many did not
* **Run duration aggregates**: a bar chart comparing the four aggregates (fastest, slowest, average, and median)
* **System information**: compute device, VRAM, RAM, PyTorch version, xFormers version, CPU, CPU cores, operating system, and architecture
A run's duration is the time ComfyUI spent executing the job on the server, not the time you waited for it. Failed runs are counted separately and left out of the statistics.
Two buttons sit with the results: **Open folder** opens the session folder, and **Export results** saves the summary and charts as a PNG image.
## Comparing Runs with Benchmarks
Benchmarks reads the results that Performance Tests saved, so it has nothing to show until at least one test has finished.
### Runs library
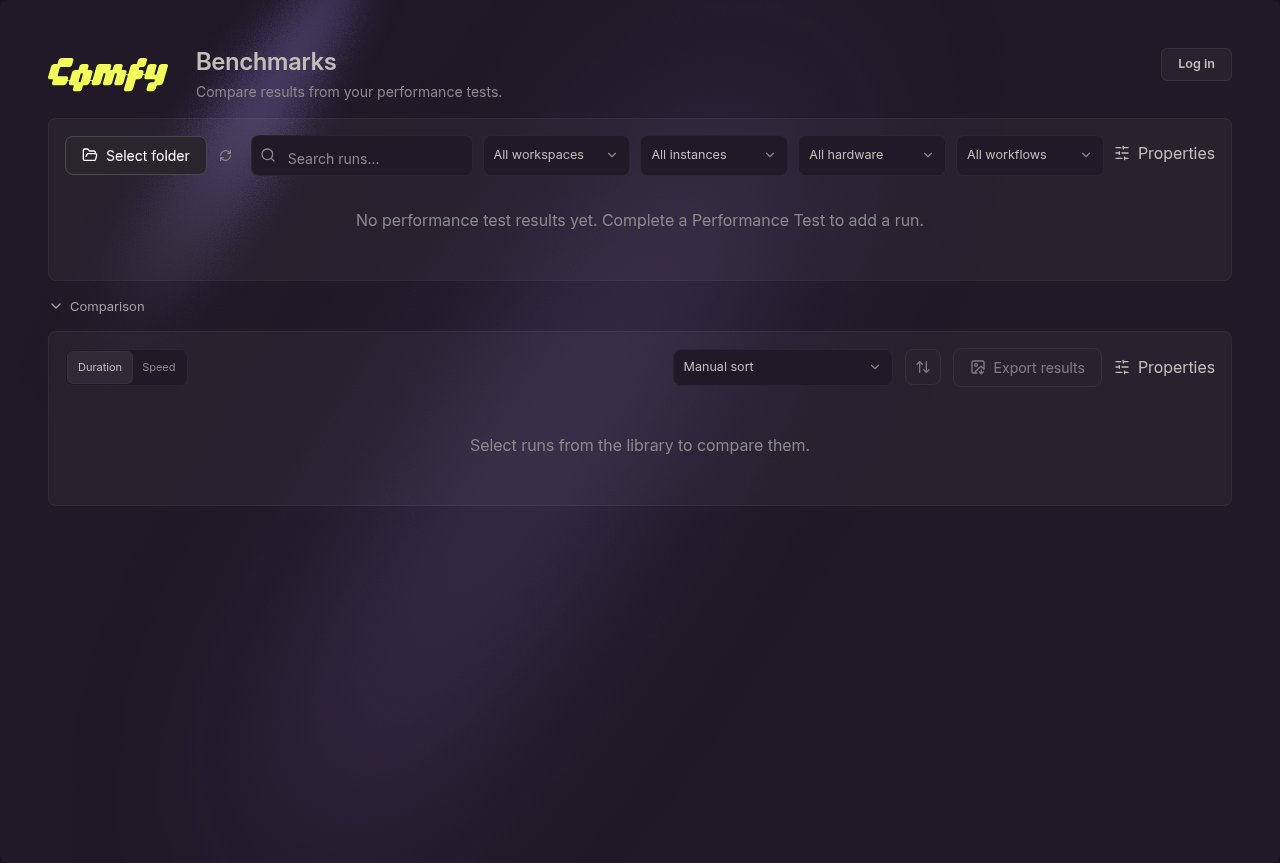
The **Runs library** lists every saved run in the results folder, newest first. Its toolbar gives you:
* **Select folder**: point the panel at a different results folder, for example a folder on a shared drive. The default is the folder Performance Tests writes to, see [Where results are stored](#where-results-are-stored).
* **Refresh sessions**: reload the folder after a test finished elsewhere.
* **Search runs**: filter the list by text.
* Dropdown filters for workspace, instance, hardware, and workflow.
* **Properties**: choose which columns the library shows (session, date and time, workflow, instance, workspace, run count, GPU and hardware).
Either way, Comfy Desktop copies the workflow into the test session folder, so the test still runs after you move or edit the original file.
### 3. Set measurement settings
| Setting | Range | Default | What it does |
| - | - | - | - |
| **Warm-up runs** | 1 to 5 | 1 | Runs executed first to load models and warm up caches. They are not included in the results. |
| **Measured runs** | 1 to 100 | 5 | Runs timed after the warm-up runs. Their durations are used to calculate the results. |
Every run advances the workflow's numeric seed inputs by one, so the measured runs do not repeat an identical cached result.
Once the three steps are set, click **Run** to start the test. The **Stop** button next to it cancels a test that is in progress.
### Read the results
While the test runs, the panel shows how many runs have finished and the instance logs. When every run finishes, the instance is stopped and the results appear:
* **Fastest run**, **Slowest run**, **Average run**, and **Median run**, in seconds
* **Measured runs** and **Failed runs**: how many runs produced a duration and how many did not
* **Run duration aggregates**: a bar chart comparing the four aggregates (fastest, slowest, average, and median)
* **System information**: compute device, VRAM, RAM, PyTorch version, xFormers version, CPU, CPU cores, operating system, and architecture
A run's duration is the time ComfyUI spent executing the job on the server, not the time you waited for it. Failed runs are counted separately and left out of the statistics.
Two buttons sit with the results: **Open folder** opens the session folder, and **Export results** saves the summary and charts as a PNG image.
## Comparing Runs with Benchmarks
Benchmarks reads the results that Performance Tests saved, so it has nothing to show until at least one test has finished.
### Runs library
The **Runs library** lists every saved run in the results folder, newest first. Its toolbar gives you:
* **Select folder**: point the panel at a different results folder, for example a folder on a shared drive. The default is the folder Performance Tests writes to, see [Where results are stored](#where-results-are-stored).
* **Refresh sessions**: reload the folder after a test finished elsewhere.
* **Search runs**: filter the list by text.
* Dropdown filters for workspace, instance, hardware, and workflow.
* **Properties**: choose which columns the library shows (session, date and time, workflow, instance, workspace, run count, GPU and hardware).
 ### Compare runs
Select two or more runs with the checkboxes, or use **Select all visible runs**. The three newest runs are selected for you when the library loads. A selection opens the **Comparison** section below the library.
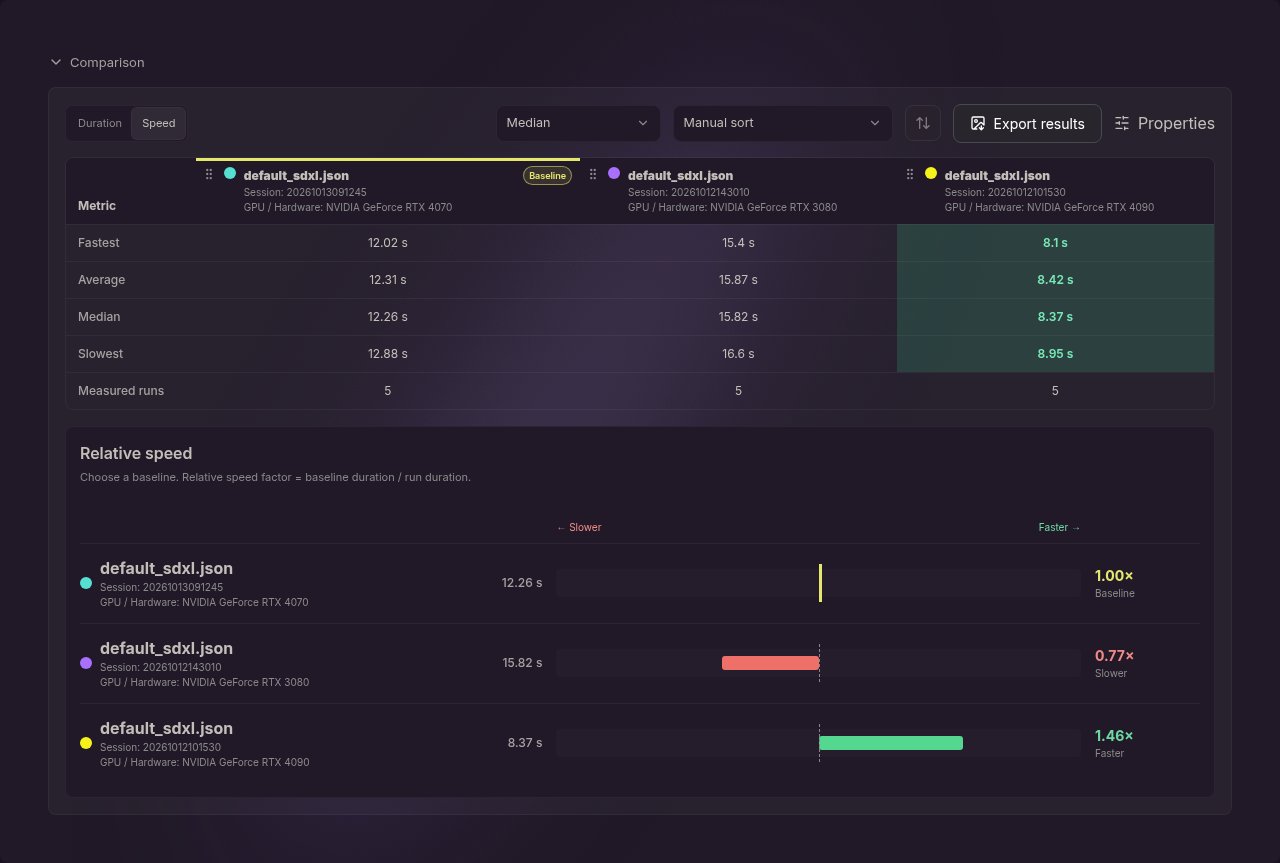
Comparison puts one column per selected run next to a set of metric rows: fastest, average, median, and slowest duration, plus the measured run count. One run is the **baseline**. By default it is the first column shown. In the **Speed** view, click a column heading to make that run the baseline instead.
### Relative speed
The comparison has two views, **Duration** and **Speed**, which you switch between in the comparison toolbar. Relative speed belongs to the **Speed** view, and the baseline is chosen there too.
**Relative speed** is the baseline duration divided by a run's duration:
* **1.00×** means the run is the same speed as the baseline
* A factor above 1.00× means the run is **faster** than the baseline
* A factor below 1.00× means the run is **slower** than the baseline
The **Speed** view plots each run on a logarithmic axis with **Slower** to the left and **Faster** to the right, so a 2x and a 4x difference stay readable on the same chart. The **Duration** view draws each run's fastest and slowest result as a line with the average marked. Runs without a usable duration are labelled unavailable.
### Compare runs
Select two or more runs with the checkboxes, or use **Select all visible runs**. The three newest runs are selected for you when the library loads. A selection opens the **Comparison** section below the library.
Comparison puts one column per selected run next to a set of metric rows: fastest, average, median, and slowest duration, plus the measured run count. One run is the **baseline**. By default it is the first column shown. In the **Speed** view, click a column heading to make that run the baseline instead.
### Relative speed
The comparison has two views, **Duration** and **Speed**, which you switch between in the comparison toolbar. Relative speed belongs to the **Speed** view, and the baseline is chosen there too.
**Relative speed** is the baseline duration divided by a run's duration:
* **1.00×** means the run is the same speed as the baseline
* A factor above 1.00× means the run is **faster** than the baseline
* A factor below 1.00× means the run is **slower** than the baseline
The **Speed** view plots each run on a logarithmic axis with **Slower** to the left and **Faster** to the right, so a 2x and a 4x difference stay readable on the same chart. The **Duration** view draws each run's fastest and slowest result as a line with the average marked. Runs without a usable duration are labelled unavailable.
 ### Sort and export
* **Sort comparison** orders the columns by relative speed. **Manual sort** lets you drag columns into your own order, or press Alt+Left / Alt+Right on a focused column.
* **Export results** saves the whole comparison as a PNG image, the quickest way to attach a result to an issue or a chat message.
### Manage sessions
Each test is stored as a session. From the library you can rename a session (**Edit session**) or delete one (**Delete**). Deleting removes every file recorded for that session.
## Where results are stored
Performance Tests creates a session folder when you add a workflow to the panel, named with that moment's timestamp (`YYYYMMDDHHMMSS`):
```
📂 ComfyUI-Shared/
└── 📂 benchmarks/
├── 📂 20260930141522/
│ ├── my_workflow.json
│ ├── jobs.json
│ ├── results.json
│ └── logs.txt
└── 📂 20260930163005/
└── ...
```
| Platform | Default results folder |
| - | - |
| Windows | `%LOCALAPPDATA%\Comfy-Desktop\ComfyUI-Shared\benchmarks` |
| macOS / Linux | `~/ComfyUI-Shared/benchmarks` |
Each session folder contains:
* the workflow file the panel used
* `jobs.json`: the raw job response from the instance
* `results.json`: the summary the Benchmarks panel reads
* `logs.txt`: the instance console output from the run
Because Benchmarks reads `results.json` from every session folder it finds, copying session folders into the folder Benchmarks points at is enough to compare results from another machine.
Running the same imported workflow again writes into the same session folder and overwrites the results already stored there. To keep a result for comparison, add the workflow to the panel again before the next test.
## Requirements
* A standalone, tracked, or remote instance that Comfy Desktop can launch. The test needs a working ComfyUI instance, so it cannot run against a Cloud instance.
* A workflow the instance can execute, including any models and custom nodes it needs. A workflow you import has to be in API format; the example workflows already are, and Comfy Desktop downloads their models. If the instance rejects the workflow, the test stops and the error appears in the logs. Runs the instance accepts but that fail during execution are counted as failed runs and left out of the duration statistics.
This documentation is built and hosted on [Mintlify](https://mintlify.com), a developer documentation platform.
### Sort and export
* **Sort comparison** orders the columns by relative speed. **Manual sort** lets you drag columns into your own order, or press Alt+Left / Alt+Right on a focused column.
* **Export results** saves the whole comparison as a PNG image, the quickest way to attach a result to an issue or a chat message.
### Manage sessions
Each test is stored as a session. From the library you can rename a session (**Edit session**) or delete one (**Delete**). Deleting removes every file recorded for that session.
## Where results are stored
Performance Tests creates a session folder when you add a workflow to the panel, named with that moment's timestamp (`YYYYMMDDHHMMSS`):
```
📂 ComfyUI-Shared/
└── 📂 benchmarks/
├── 📂 20260930141522/
│ ├── my_workflow.json
│ ├── jobs.json
│ ├── results.json
│ └── logs.txt
└── 📂 20260930163005/
└── ...
```
| Platform | Default results folder |
| - | - |
| Windows | `%LOCALAPPDATA%\Comfy-Desktop\ComfyUI-Shared\benchmarks` |
| macOS / Linux | `~/ComfyUI-Shared/benchmarks` |
Each session folder contains:
* the workflow file the panel used
* `jobs.json`: the raw job response from the instance
* `results.json`: the summary the Benchmarks panel reads
* `logs.txt`: the instance console output from the run
Because Benchmarks reads `results.json` from every session folder it finds, copying session folders into the folder Benchmarks points at is enough to compare results from another machine.
Running the same imported workflow again writes into the same session folder and overwrites the results already stored there. To keep a result for comparison, add the workflow to the panel again before the next test.
## Requirements
* A standalone, tracked, or remote instance that Comfy Desktop can launch. The test needs a working ComfyUI instance, so it cannot run against a Cloud instance.
* A workflow the instance can execute, including any models and custom nodes it needs. A workflow you import has to be in API format; the example workflows already are, and Comfy Desktop downloads their models. If the instance rejects the workflow, the test stops and the error appears in the logs. Runs the instance accepts but that fail during execution are counted as failed runs and left out of the duration statistics.
This documentation is built and hosted on [Mintlify](https://mintlify.com), a developer documentation platform.